
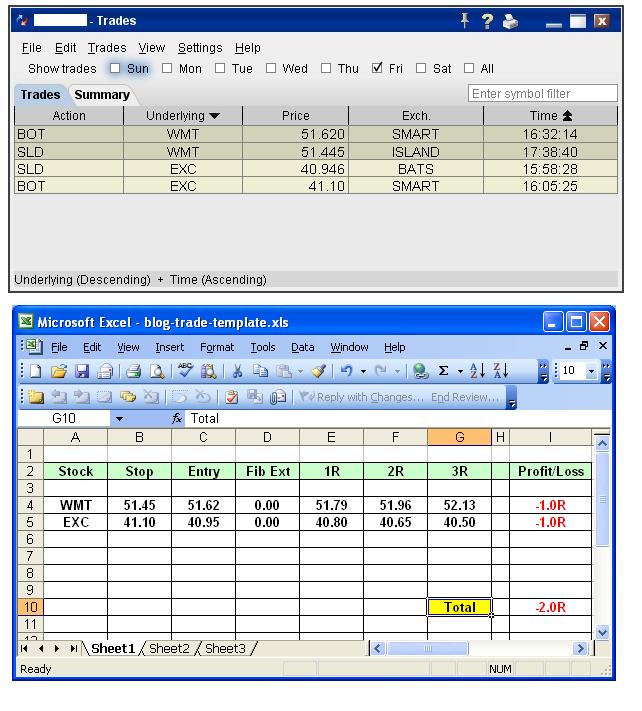
Initial fall and retrace but rejects off previous day low then trends down. Consolidates at the whole number. Trigger is as shown for breakout to downside and thru whole number. Didn't work out and stopped for a loss.
WMT (gap up)

Strong initial price action relative to market. Trends up and trigger is marked on breakout to new high. Didn't work as planned and stopped for a loss.
------------ Daily Stats ----------------
4 comments:
Howdy I was looking at both your charts. I am trying to figure out what you are using as a guide to enter the trade. Are you looking backwards to find levels of supply and demand to trade off. Hope all is well.
EXC 2/30" doji. MCD 11:30est 15"doji" bad trade but made a profit. consider some eps plays: amzn sndk, WMT I would have been right on that at the open. everybody knows about it. I cancelled a AMZN 110augC 3.7...went to 10.85!
AJ > Yes, sort of. Trending down then consolidation at lows or high. Then entry is on breakout to new high or low. That is the sort of price action on stocks I am looking for, but I only enter when the general market is showing momentum in the direction of the trade. For example if market (DOW) is trending up then retraces then resumes trend up > I am looking for longs on stocks which have shown to be stronger than the market.
This 5min trading is something I'm still trialling and testing to see how it stacks up profit wise.
Thanks
I am too trying to trade on the 5 minute charts. I have been doing most of my trading off 60's but it is also more swing trading. I like to look to the left and see where everyone bought and sold out before. Again please don't feel like I am questioning your trading skills or anything like that just like to talk about trading. Have a great day. Jay
Post a Comment