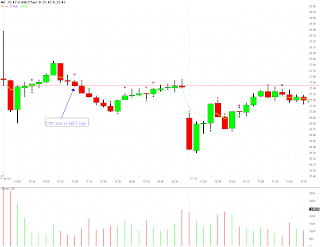
Here is chart for MI which gapped down on 04th Feb.

First candle is red dragonflyish candle indicating bearishess. Subsequently we have price action which trends back into the OR (opening range), but does not retrace more than half way in. We then have 3 red candles and a descending ema. The 11th candle is a NR7 which closes right on the OR low. This is our trigger candle. The next candle is a red hammer like candle which closes near it lows, thus adding some confidence to our approach of shorting this stock.
Entry : 27.40, Stop is 27.58.
The Fib ext : $26.83.
1R= 27.22, 2R=27.04, 3R=26.86
Once 1R price was reached, moved stop to Breakeven.
Took partial at 2R since it was a whole number and previous support. Left the rest to run and it stopped out at breakeven.
No comments:
Post a Comment